This article explains how to fix an annoying issue when trying to debug a Blazor WASM (WebAssembly) project. In my case, I had a Blazor WASM SWA (Static Web App), that built just fine and ran well in Azure, but refused to be debugged.
What an annoying little problem. I mean – it’s not a problem until you have a problem to investigate. But when you can’t investigate a problem, then you do have a problem.
So let’s take a closer look. At the problem, that is.
Problem
So, imagine this: You’re busy developing your Blazor WebAssembly project in Visual Studio 2022. Maybe it’s even a MAUI project, like it was for me. But maybe it isn’t – I suspect the problem could happen in either case.
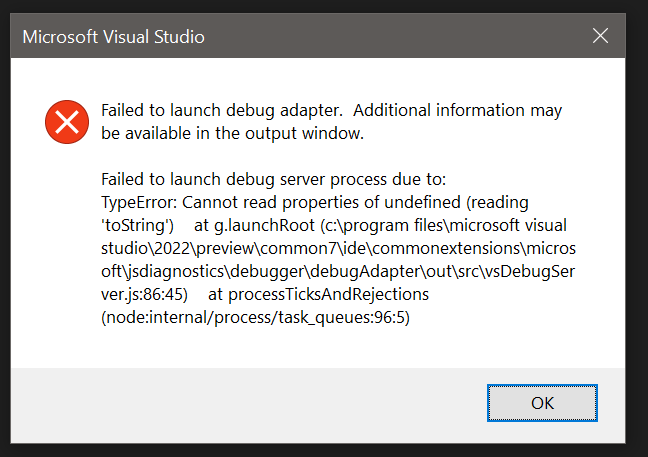
But any time you try to start your Blazor WebAssembly app with debugger attached, it’ll take just a bit and then throw something like below:

And this is not random. It will happen every single time. And while hot reloading and adding nice Console.WriteLine(“Got here!”) statements are both great alternatives, sometimes I just feel like they don’t do the trick.
So what do we do to make debugging work again?
Solution
This solution applies to at least building Blazor WebAssembly MAUI project on .NET 7 using Visual Studio 2022.
Time needed: 10 minutes
How to fix the “Failed to launch debug adapter. Additional information may be available in the output window.” error when trying to debug Blazor WebAssembly?
- Don’t use a Preview version of Visual Studio
This one has bitten me before, and will probably do in the future… But if something is not working right when you’re hacking your code together with a freshly baked Preview build of Visual Studio, try giving the stable version a try instead.
Sometimes, things in Preview break. Stable might not have all the shiny bits the Preview version does, but it is likely, well, more stable. - Remove and re-add the inspectUri
Sometimes, something odd happens and messes with your launchsettings.json file. Maybe it was a Visual Studio update, maybe it was some part of your tooling – or maybe it was you – but in any case, the inspectUri in the file might be wrong.
And call me crazy, but sometimes I feel like it’s not wrong, but it still won’t work. And this step still might help:
Remove the whole line. Save the file. And the add it back.
Not sure what to add? You can use this below:"inspectUri": "{wsProtocol}://{url.hostname}:{url.port}/_framework/debug/ws-proxy?browser={browserInspectUri}"
- Still not working?
Oh, still not working for you? Well, that was all I had. These 2 fixes have fixed this one for me. Sorry! :(
Got any other fixes, or an issue not fixed by the tricks above? Let me know in the comments -section below!
References
- CSOM suddenly throwing exceptions when trying to access list contents in SharePoint? A weird fix. - April 2, 2024
- “Predefined type ‘System.Object’ is not defined or imported” and other System namespace stuff missing in your solution? - March 26, 2024
- How to import GraphQL schema to Postman in Windows? - March 19, 2024


