This post was most recently updated on August 26th, 2022.
2 min read.This post describes a quick solution to launching a new Visual Studio instance for debugging the code. There are a lot of applications for this, but where I’ve found it exceptionally useful, has been in debugging the Entity Framework’s code-first migration (one of the ways for database initialization) Seed-method.
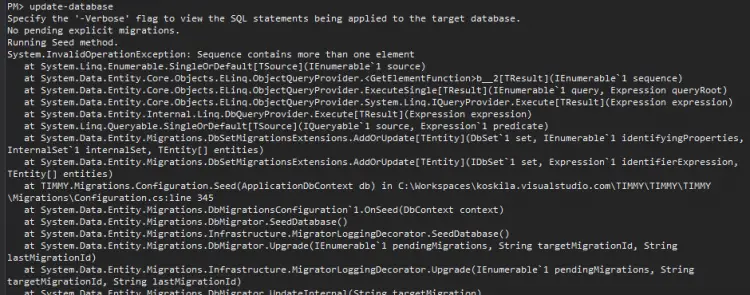
It is by default undebuggable, as when you are running Update-Database you can’t really use a -debug switch or anything, and there’s really no way to launch the debugger. Hence the best you can do is using -verbose to get more information.
However, if you actually want to see what is happening in the code, you CAN actually launch and attach the debugger to your code. Here’s the solution!
Solution: Launching the debugger programmatically
Okay – this is quick and dirty, but still pretty darn cool.
You can make your C# code launch a new Visual Studio instance to debug what you’re doing, by inserting the following line anywhere in your code:
System.Diagnostics.Debugger.Launch();That alone is kind of dirty, and actually might end up causing recursive debugger launches – so you probably don’t want that! You’ll need a bit more code around the call, to make sure you only start debugging when it actually makes sense.
Basically, you’ll want to check if you already have a debugger attached to your code, you don’t want to launch it again. You can access the info from System.Diagnostics.Debugger namespace, which has the “IsAttached” property, that’ll be true if a debugger instance is already attached to your code.
So, in short, we can check for any attached debuggers with System.Diagnostics.Debugger.IsAttached and just wrap a simple conditional block around our call to System.Diagnostics.Debugger.Launch(). This lets only attach a new debugger instance only when we don’t have one – and we’ll avoid recursive debugger attachments :)
Hence the following code:
if (System.Diagnostics.Debugger.IsAttached == false)
{
  System.Diagnostics.Debugger.Launch();
}
This code will nicely fire open a new instance of Visual Studio and start debugging whatever’s at the function where you invoked the call. It’s kind of slow – it’ll actually open up a new instance of Visual Studio, and as we all know, that tends to take a while!
After Visual Studio opens up, it should make it possible for you to debug line by line, starting from where you launched it. You can also set breakpoints as you wish, and that should work as usual!
References
Read more on Microsoft Docs!
He's been a developer from 2004 (starting with PHP and Java), and he's been working on .NET projects, Azure, Office 365, SharePoint and a lot of other stuff. He's also Microsoft MVP for Azure.
This is his personal professional (e.g. professional, but definitely personal) blog.


