
This post was most recently updated on August 31st, 2022.
5 min read.Have you ever wondered, how SharePoint’s Managed Properties for Usage & Analytics info actually work? There are all these nice properties available for getting view counts for different items in SharePoint’s search index, but they all seem to act like crazy. Plus they are sometimes pretty nonsensical… And not very well documented!
In this post, I’ll try to make some sense of how you can use them in programmatic scenarios. Read on…
Update 12.3.2019: I’ve updated the post based on a lot of empirical research :)
What properties are we talking about?
Ah, yeah. That might be a good way to start the post.
We’re talking about all the managed properties, that SharePoint populates for view counts. There really is a bunch of them, and while they’re not very reliable, they might still be useful for fetching the most popular stuff or comparing usage/views of certain items over time.
Over very limited, predefined time, that is. Anyway, let’s look at the list of properties, and what they mean!
In this post, I’m skipping using the “Unique” -versions of the properties. They’re typically measuring unique users instead of views – but in this example, we’re more interested in view counts, and what they mean.
How to browse the values for view counts in your environment?
You can access this URL to get the view counts for items on your intranet site – feel free to modify it to apply different filtering:
https://[your_intranet_sitecollection_root_url]/_api/search/query?querytext=%27Path:https://[path_to_your_intranet_site]*%20(contentclass=STS_Site%20OR%20contentclass=STS_Web)%27&selectproperties=%27Title,ViewsLast1Days,ViewsLast2Days,ViewsLast3Days,ViewsLast4Days,ViewsLast5Days,ViewsLast6Days,ViewsLast7Days,ViewsRecent,ViewsLastMonths1,ViewsLastMonths2,ViewsLastMonths3,ViewsLifetime,Path%27&orderBy=ViewsRecent&trimDuplicates=false&rowlimit=500
This query basically returns you all web or site home pages with their titles, paths, and all available usage properties. As a result, you get something like this (an example is a home/welcome page of a SharePoint Site):
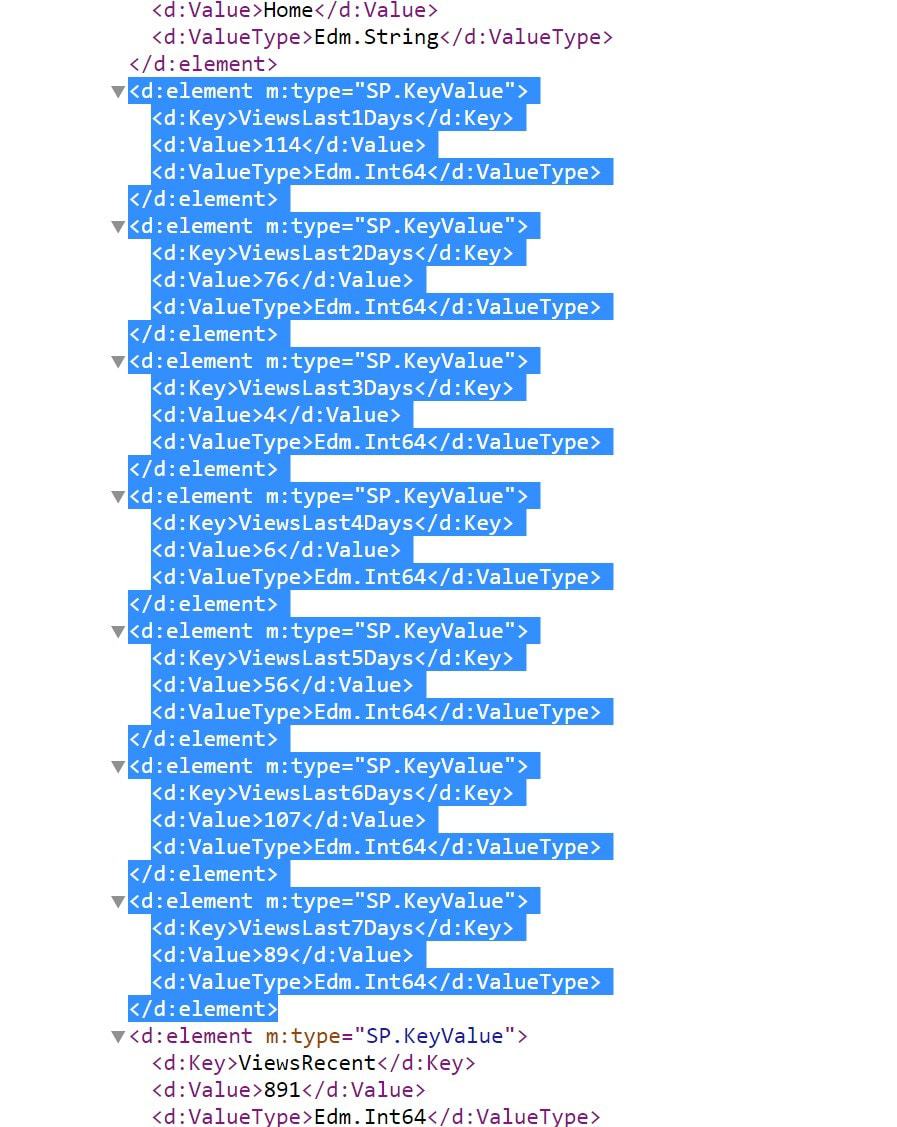
So, what do these managed properties actually contain? They are not all equal – let’s take a closer look!
List of Usage-related managed properties in SharePoint Search Index
You can get the unique views (supposedly, only one per user, but this is probably more like one per sticky session and not actually user-related at all) by appending “UniqueUsers” or “Unique” at the end of the property name. More precisely, for all the other properties, append “UniqueUsers”, but for month-related properties, append “Unique”.
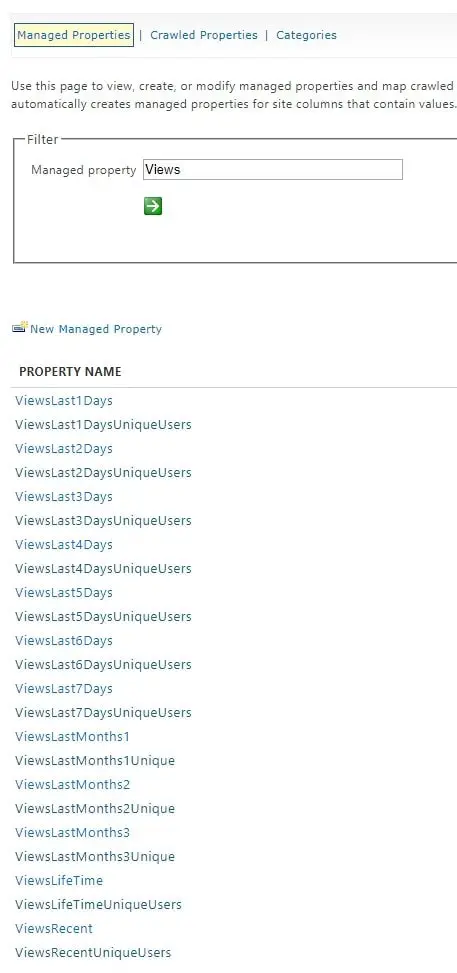
So, the total list of all properties is something like this:
All Usage-related Managed Properties in SharePoint Online’s Search index
- ViewsLast1Days
- ViewsLast1DaysUniqueUsers
- ViewsLast2Days
- ViewsLast2DaysUniqueUsers
- ViewsLast3Days
- ViewsLast3DaysUniqueUsers
- ViewsLast4Days
- ViewsLast4DaysUniqueUsers
- ViewsLast5Days
- ViewsLast5DaysUniqueUsers
- ViewsLast6Days
- ViewsLast6DaysUniqueUsers
- ViewsLast7Days
- ViewsLast7DaysUniqueUsers
- ViewsLastMonths1
- ViewsLastMonths1Unique
- ViewsLastMonths2
- ViewsLastMonths2Unique
- ViewsLastMonths3
- ViewsLastMonths3Unique
- ViewsLifeTime
- ViewsLifeTimeUniqueUsers
- ViewsRecent
- ViewsRecentUniqueUsers
It’s kind of weird how inconsistent this naming is just in general… But hey, it’s SharePoint :)
Here’s the list with explanations and example values (I’m omitting the Unique-versions to keep it concise):
What’s the meaning of different Usage-related Managed Properties in SharePoint?
| Property Name | Collection time scope | Example value in a typical situation (intranet for a small organization, observation day: a Wednesday on the last week of September) | Explanation |
|---|---|---|---|
| ViewsLast1Days | Non-cumulative; just the value for one day. | 351 | Views of the last full day – in our case, Tuesday. |
| ViewsLast2Days | 375 | Views of the day before the last full day, so in our case, Monday. | |
| ViewsLast3Days | 15 | Views of the day before; in our case, Sunday. | |
| ViewsLast4Days | 6 | Views of just Saturday. You know, a day before the last one. | |
| ViewsLast5Days | 275 | Friday. The same thing as before. | |
| ViewsLast6Days | 472 | Thursday. You know. | |
| ViewsLast7Days | 468 | Wednesday. | |
| ViewsRecent | Cumulative: 2 weeks (14 days, not calendar weeks) | 1042 | All of the views of 14 last full days lumped together. However, on-premises this is configurable to be whatever between 1-14 days. |
| ViewsLastMonths1 | Cumulative: daily views of current month. | 1278 | All of the views of the current month (e.g. September). |
| ViewsLastMonths2 | Cumulative: A full (calendar) month | 1329 | All of the views of the last full month (e.g. August). |
| ViewsLastMonths3 | 1476 | All of the views of a month before the one above (e.g. July). | |
| ViewsLifetime | Cumulative: Lifetime | 85445 | Sum of all the views since the document was created. |
These are based on a combination of shoddy documentation and my unreliable observations. Last updated on 12.3.2019.
So, based on the examples – ViewsLast7Days, for example, is essentially the view count, for the day that “started 7 days ago”. It’s not the views for the last 7 days, like the name claims.
Weird, huh? Well, it gets even more interesting!
You can see, that there are no properties available for “Views for last week”. You can, however, get the views for the last 14 days by using ViewsRecent -property. It’s not 2 calendar weeks, though – so be mindful when using it!
Oh – and on-premises, it’s not necessarily 14 days either. You can change it with PowerShell. So it can be almost anything! You can check what the current value is by running this PowerShell:
<pre lang="powershell">
$SSP = Get-SPEnterpriseSearchServiceApplicationProxy
$tenantConfig = $SSP.GetAnalyticsTenantConfiguration([Guid]::Empty)
# We're using EventTypeId 1, since that means "Views"
$event = $tenantConfig.EventTypeDefinitions | where-object { $_.EventTypeId -eq 1 }
# This is 14 by default - this example first outputs what it is currently, and then changes it to 7
$event.RecentPopularityTimeFrame
$event.RecentPopularityTimeFrame = 7
$tenantConfig.Update($SSP)
</pre>
After running the script above, your “ViewsRecent” should be 7.
Note: There are examples online that show the RecentPopularityTimeFrame being set to 28 (my example was copypasted from one such case earlier). This shouldn’t work – per Microsoft’s documentation, 14 is the maximum. See Microsoft’s documentation for RecentPopularityTimeFrame for more info!
Probably goes without saying, that I’m not 100% sure of all of the details. But I’ve been wrestling with these properties for quite a bit, so the findings should match the functionality as of writing this (check out the last updated -date at the top of the post).
How to interpret the values for different properties?
Looking at the samples and explanations before, we can see a few trends from these values. Just from these values, you can quite clearly see the weekend and vacation season (drop in page loads for August). These are very typical for Intranet sites, and you can verify the same trends using a more refined analytics solution (like Google Analytics).
If you want to count together views for the last 3 days, you need to calculate:
ViewsLast1Days + ViewsLast2Days + ViewsLast3Days
Similarly, counting visits for the last 2 months (in our example, August + July), you’d need to sum together:
ViewsLastMonths1 + ViewsLastMonths2
I don’t know if the naming scheme bothers anyone else, but I think it’s pretty bad. It’s notoriously difficult to change something like that, though, so it’s entirely possible, that Microsoft has changed how the properties work at some point without changing the names. Or they might’ve had different teams working on different time scales – who knows?
Caveat: Sums are not always actually sums.
Because of something called tail-trimming, SharePoint doesn’t actually calculate view counts for days, when view counts are low. Theoretically, only days with really low (under 3) views per day should be omitted from all values, but like with so many other things in SharePoint, I would take this with a grain of salt. Sums of different viewcounts won’t match, though, that’s for sure.
Problem: All of these property values are null!
Ruh-roh! That’s pretty typical. Might be worth another article, but a couple of quick pointers:
- Are you on-premises?
- You’re either missing mappings, your usage & analytics service is down, you don’t have Enterprise features enabled, you don’t have the metrics receivers enabled, you’re out of disk space on the crawler/indexing application server, or something similar.
- Are you on O365?
- Try Using SharePoint Search Query Tool to check if the properties are available and have values.
- Export an Excel report from Usage/popularity trends to see if the usage service is down. If the report doesn’t work either, open a ticket at Microsoft support.
He's been a developer from 2004 (starting with PHP and Java), and he's been working on .NET projects, Azure, Office 365, SharePoint and a lot of other stuff. He's also Microsoft MVP for Azure.
This is his personal professional (e.g. professional, but definitely personal) blog.
- “Critical Error – Your Start menu isn’t working” - April 23, 2024
- How to export a CSR you’ve created on Windows? - April 16, 2024
- How to output all Environment Variables in Azure DevOps with PowerShell? - April 9, 2024


